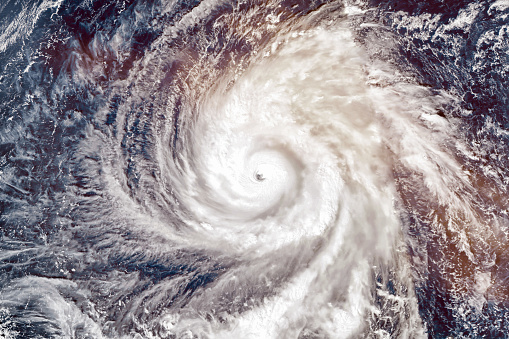
Shiny is an R package that simplifies the creation of interactive web applications directly from R. In this project, we leverage R Shiny to craft a dynamic dashboard capable of visualizing historical and projected weather events in the USA dating back to 1950.
R packages are an organized collection of functions, datasets, and documentation in a standardized format that enhance the capabilities of R beyond its base functionalities. Through my expertise in package development, I've created packages with monthly downloads exceeding 600, demonstrating my proficiency in extending the functionality of R.
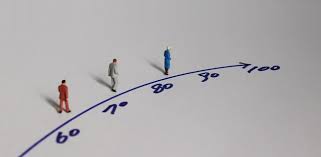
R stands out as a robust tool for mortality modeling and projection. Here, we employ generalized linear models (GLMs) to effectively model and project mortality trends.

Microsimulation is a potent tool for evaluating health decisions, allowing us to analyze different decision paths and their respective impacts. In this demonstration, we showcase the implementation of microsimulation models using R, highlighting its effectiveness in decision evaluations within the healthcare domain.
Sweave, a versatile function in R, empowers seamless integration of R code into LaTeX or LyX documents, fostering dynamic reports and reproducible research. In this example, I offer a customizable Sweave template designed for crafting interactive presentations. Additionally, I demonstrate techniques to animate graphs, enhancing presentation engagement and interactivity.

R Markdown serves as a comprehensive authoring framework for crafting dynamic analysis documents that seamlessly blend code, rendered output, and prose. Here, I offer a customizable R Markdown template tailored for creating presentations within R. Furthermore, I demonstrate the utilization of LaTeX for formatting the preamble, enhancing the document's professional appearance and functionality.